Unveiling the Insights: A Guide to Analyzing Likert Scale Data
In a world saturated with information, understanding people's opinions and perceptions is paramount. Whether you're a seasoned researcher or just starting to explore the world of data collection, Likert scales offer an elegant solution for capturing nuanced feedback. Imagine being able to gauge customer satisfaction, employee engagement, or public opinion on a specific issue – all through a series of carefully crafted statements and a simple rating system. This is the power of the Likert scale, a psychometric scale that has become a cornerstone of survey research.
But collecting data is only half the battle. The true magic lies in unlocking the insights hidden within those numerical responses. This is where understanding how to analyze Likert scale data becomes crucial. It's like having a beautifully tailored suit – the fabric and stitching are essential, but it's the cut and fit that truly elevate the garment. Similarly, mastering the art of Likert scale data analysis allows you to transform raw data into actionable intelligence, empowering you to make informed decisions and achieve your research goals.
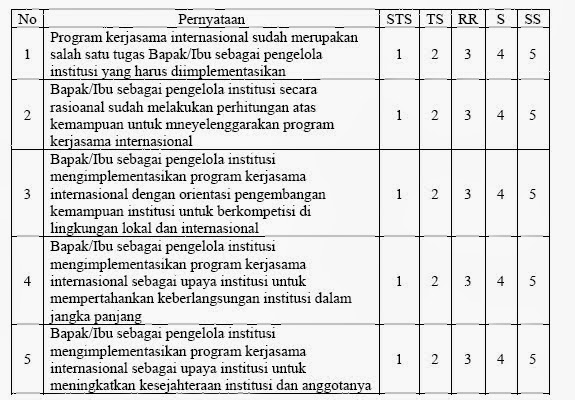
The beauty of the Likert scale lies in its simplicity. Developed by American psychologist Rensis Likert in the 1930s, this method presents respondents with a statement and asks them to indicate their level of agreement or disagreement using a symmetrical scale. Typically, this involves five to seven response options, ranging from "Strongly Disagree" to "Strongly Agree," with a neutral midpoint. This straightforward approach makes it easy for people to understand and respond to, reducing survey fatigue and improving response rates.
However, this simplicity can be deceptive. While assigning numerical values to each response option might seem straightforward, treating Likert scale data as interval data – where the differences between points on the scale are equal – can lead to misinterpretations. For instance, assuming that the difference between "Agree" and "Strongly Agree" is the same as the difference between "Disagree" and "Neutral" may not accurately reflect the respondents' true sentiments.
Instead, Likert scale data is often best analyzed using descriptive statistics, such as calculating the mode (most frequent response), median (middle response), and frequencies (percentage of respondents selecting each option). These measures provide a clear picture of the overall distribution of responses, highlighting areas of agreement, disagreement, or neutrality. Additionally, exploring the data through visualizations, such as bar charts or pie charts, can further enhance understanding and facilitate communication of findings.
Advantages and Disadvantages of Using Likert Scales
Like any tool, Likert scales come with their own set of advantages and disadvantages:
| Advantages | Disadvantages |
|---|---|
| Easy to understand and administer | Prone to central tendency bias (respondents leaning towards neutral options) |
| Allows for capturing a range of opinions and perceptions | Susceptible to acquiescence bias (respondents agreeing with most statements) |
| Suitable for measuring subjective experiences and attitudes | Limited ability to capture the reasons behind responses |
| Amenable to statistical analysis | Cultural and linguistic factors can influence interpretations of response options |
Understanding both the strengths and limitations of Likert scales is essential for maximizing their effectiveness in research and ensuring that the insights derived from the data are accurate and reliable. Just as a discerning eye recognizes the nuances of a well-crafted garment, a skilled researcher approaches data analysis with a critical and informed perspective.
Unlocking the secrets a guide to merge dragons elder fruit tree levels
Navigating the labyrinth finding the best roast for any situation
The untold story what happened to general macarthurs son


