Contour Lines: Unlocking the Secrets of Maps and Graphs
Imagine a hiker navigating a mountain range. How do they know the steepness of the slopes, the location of peaks and valleys, without physically exploring every inch? The answer lies in the elegant simplicity of contour lines, also called level curves, isopleths, or isolines.
Contour lines, these seemingly simple lines on a map, are powerful tools for visualizing three-dimensional data on a two-dimensional surface. They represent points of equal value, whether it's elevation on a topographic map, temperature on a weather map, or air pressure on a meteorological chart. By connecting points of equal value, contour lines create a visual representation of the shape and characteristics of the surface being depicted.
The concept of contour lines isn't new. Dutch engineer Nicholas Cruquius is credited with one of the earliest uses of contour lines to represent the depth of the river Merwede in 1727. Since then, their use has expanded across numerous fields, from geography and meteorology to engineering and economics. Their importance lies in their ability to convey complex information in a readily understandable format.
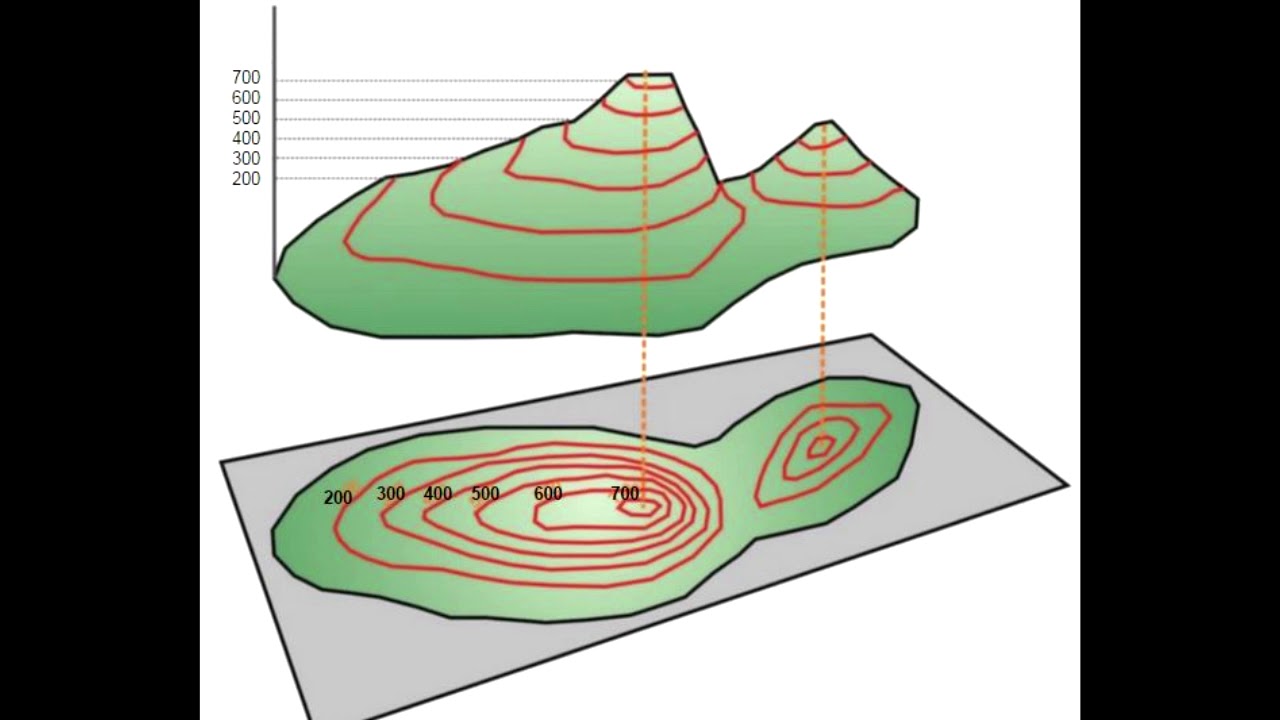
One of the key challenges with contour lines, particularly for beginners, is interpreting their spacing and shape. Closely spaced lines indicate a steep gradient, while widely spaced lines signify a gentler slope. Concentric closed loops indicate peaks or depressions, with the highest or lowest value located at the center. Understanding these patterns is crucial for accurately interpreting the information presented by the contour lines.
While visually intuitive, mastering the interpretation of contour lines requires practice and attention to detail. Misinterpreting the spacing or shape of these lines can lead to inaccurate conclusions about the underlying data, whether it's the elevation of a mountain or the distribution of temperature across a region.
Let's take the example of a topographic map. Contour lines represent lines of equal elevation. Each line connects points on the map that are at the same height above sea level. If you were to walk along a contour line, you would neither ascend nor descend. The closer the lines are together, the steeper the terrain. Widely spaced lines indicate a gentler slope.
Three key advantages of using contour lines are: visualization of 3D data on a 2D surface, simplified representation of complex data, and facilitation of quick analysis and decision-making.
Imagine you're planning a hiking trip. Contour lines on a topographic map can help you choose a route that avoids steep climbs or descents. They can also help you identify potential hazards, such as cliffs or valleys.
Here are some best practices for using contour lines: understand the scale and interval, pay attention to the shape and spacing of lines, and use a key or legend to interpret the values.
A concrete example would be using contour lines on a weather map to identify areas of high and low pressure, which are crucial for predicting weather patterns.
Advantages and Disadvantages of Contour Lines
While contour lines are powerful tools, they also have limitations. For instance, they can oversimplify complex terrains and may not represent small-scale variations accurately.
FAQ:
1. What are contour lines? - Lines of equal value on a map or graph.
2. What is another name for contour lines? - Level curves, isolines, or isopleths.
3. How are contour lines used in topography? - To represent elevation.
4. What does close spacing of contour lines indicate? - Steep slope.
5. What does wide spacing of contour lines indicate? - Gentle slope.
6. Who is credited with one of the earliest uses of contour lines? - Nicholas Cruquius.
7. What are some applications of contour lines? - Mapping terrain, weather forecasting, economic analysis.
8. What is a key challenge with interpreting contour lines? - Understanding their spacing and shape.
Contour lines offer a valuable tool for understanding data visualized on maps and graphs. Whether navigating a mountain range, predicting weather patterns, or analyzing economic trends, contour lines provide a powerful visual aid. They allow us to grasp complex information quickly and efficiently. By mastering the art of interpreting these lines, we unlock a deeper understanding of the world around us. From planning hikes to making informed decisions based on data, the applications of contour lines are vast and their importance undeniable. Take the time to understand and utilize this powerful tool, and you'll unlock a new level of insight into the world around you.
Diffusion gratuite de sport en direct acces illimite aux evenements sportifs
Restaurer la magie votre guide complet pour disney dreamlight valley
Sublimez votre hiver le guide complet des patrons de couture robe hiver


